This is going to be the design considerations page
Hydrologic Sub-basin
Design Characteristics
Figure 6: Example Area Calculation
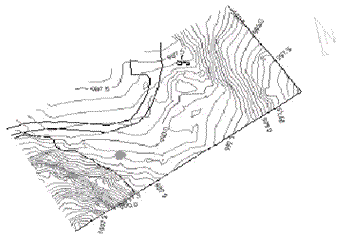
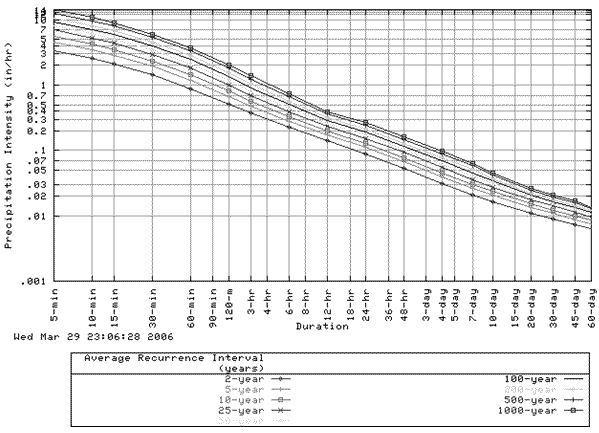
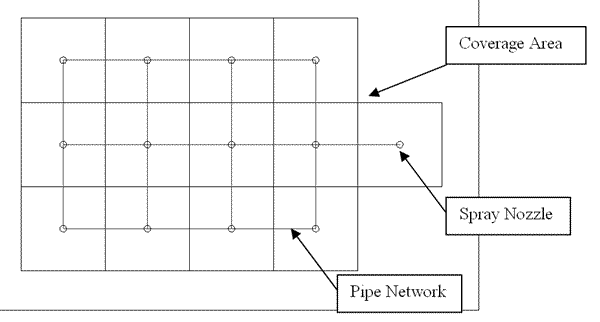
The location of the hydrologic demonstration will be in the southeast corner of the Onsite Waste Water Treatment Facility (see Figure 3). This location was chosen because there is a natural channel that will provide a centralized location for the simulated storm runoff. This will provide an ideal location for taking discharge measurements. Figure 7: Location of Hydrologic Demonstration The Hydrologic Demonstration is designed to simulate a 100 year rainfall. Because the rainfall simulation will fall on a small area, the amount of rainfall needed to model a 100 year storm needed to be found. This data was taken from the National Weather Services website collection of intensity-duration-frequency (IDF) curves. The IDF curve is a curve used to predict rainfall intensity recurrences. They are “graphical representations of the probability that a certain average rainfall intensity will occur” (Hydrology & Floodplain Analysis). The IDF curve for Flagstaff, AZ was used in this case to calculate the rainfall intensity needed to simulate the 100 year storm since the demonstration site is within the city of Flagstaff (see Figure 2). Because the hydrologic demonstration does not cover a well defined basin or watershed, historical rainfall data could not be used to predict the 100 year rainfall at the site. The IDF curve allows us to predict this because it is a representation, not historical data. Figure 8: IDF Curve for Flagstaff, AZ Using the 100-year IDF curve from Figure 2, the precipitation intensity for a 30-minute duration was found to be 3.95in/hr. Knowing that the maximum allowable volume with the given flow rate on the site is 168ft³/hr and that our desired rainfall is 3.95in/hr, the maximum allowable area to simulate the 100-year rainfall was computed to be 510ft². In order to produce a simulated rainfall to cover the 510ft² area, a spray system that could produce the desired rainfall with the given flow rate constraints needed to be designed. The constraint with the spray system was finding a nozzle that would produce the cover needed to model the proper rainfall over the desired area. Spray Systems Co. provided a number of nozzle possibilities giving coverage areas for different height installations. Their online catalog also provided flow capacities for the different possible nozzles. With this information a nozzle type and the number of nozzles needed to cover the required area was determined. The Spray Systems Co., ⅛GG6SQ. FullJet square spray nozzle was chosen. It has a square coverage area of 76” x 76” (approximately 6.34ft²) and a capacity of 1.6gpm at 80psi. Knowing this, it was determined that 13 nozzles would be needed to cover a 510ft² area. The 13 nozzles would require 20.8gpm which is less than the maximum allowable calculated flow rate of 21gpm. The nozzles for the 100-year storm simulation will be laid out in the following configuration to produce the most efficient coverage of the required area, seven feet off the ground.
|


